Calculating Percentiles in SQL Server: an update
Aug
7
Written by:
Charles Flock
8/7/2015 2:33 PM

Our original blog on Calculating percentiles in SQL Server, published in 2011, is one of the most popular pages at westclintech.com. In this article, we talk about a table-valued approach to calculating percentiles which in some situations may improve performance dramatically over the PERCENTILE aggregate function.
Calculating percentiles requires two things: an ordered set of values and the desired percentile, which, for our purposes, is expressed as P/100 (so the 95th percentile would be 0.95). In 2011 we introduced the PERCENTILE and PERCENTILE_EXC aggregate functions for SQL Server 2008 (and 2012 and 2014). These functions are the equivalent of the Excel PERCENTILE.INC and PERCENTILE.EXC functions.
User-defined aggregate functions in SQL Server are not able to control the order in which data are passed into the function; data arrives in the order that the optimizer thinks best. The percentile functions must store the data and sort it before calculating the percentile. In our environment, we refer to these types of functions as two-pass functions as we need to pass over the data twice; first when the function receives the data it must be saved, and second, the saved data must be sorted before the result can be calculated.
Thus, the number of values that need to be sorted has a direct impact on the performance of these two functions. In our testing, these functions perform really well up to about 10,000 rows and then performance starts to lag perceptibly.
Because of this, we have created a new table-valued function, PERCENTILES, which can be used to calculate one or many percentiles from an ordered dataset. Unlike the aggregate functions which relies on the input dataset to be sorted; it does no ordering of the data. Since the table-valued function uses dynamic SQL to get the data, simply make sure that the SQL string sent into the function contains the appropriate ORDER BY.
This table tells us the elapsed time, in seconds, to return a single percentile value from a dataset with the indicated number of rows and compares the performance of the aggregate function and the table-valued function.
|
Number of Rows
|
Elapsed Time
|
|
|
Aggregate
|
TVF
|
|
1,000
|
0.003
|
0.03
|
|
10,000
|
0.113
|
0.043
|
|
20,000
|
0.67
|
0.103
|
|
30,000
|
1.103
|
0.143
|
|
40,000
|
2.293
|
0.203
|
|
50,000
|
3.413
|
0.326
|
|
60,000
|
4.52
|
0.376
|
|
70,000
|
6.31
|
0.39
|
|
80,000
|
7.713
|
0.57
|
|
90,000
|
9.493
|
0.516
|
|
100,000
|
11.5
|
0.5
|
|
200,000
|
39.97
|
1.083
|
|
300,000
|
82.846
|
1.71
|
|
400,000
|
138.2
|
2.193
|
|
500,000
|
207.126
|
2.813
|
Here's a graphical representation of the data.
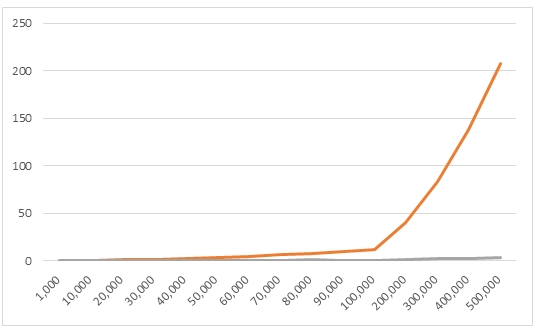
As you can see, the table-valued function performs significantly better than the aggregate as input volumes increase, exhibiting almost linear growth rather than the exponential growth of the aggregate function. In our environment with millions of rows of data with 100 percentile points to be evaluated we have found the table-valued function to perform thousands of times faster than the aggregate function.
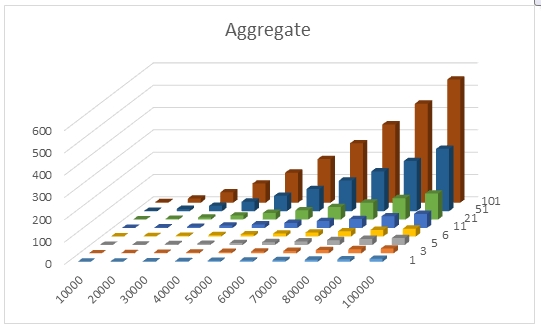
We did further analysis and looked at performance based not only on the size of the input dataset but also based on the number of points of interest. For example, for a given dataset you might be interested in calculating the 0th, 25th, 50th, 75th, and 100th percentile (the quartiles). This results in 5 invocations of the aggregate function. If you were interested in the quintiles, there would be 6 invocations; the deciles, 11 invocations, and so on.
We ran a script that created a normal distribution with a mean of 100 and a standard deviation of 15 for 10,000 to 100,000 rows in multiples of 10,000. For each of these datasets we then calculated 1, 3, 5, 6, 11, 21, 51, and 101 percentile values. The following table summarizes the results for the aggregate function.
|
|
Elapsed Time in Seconds
|
|
|
1
|
3
|
5
|
6
|
11
|
21
|
51
|
101
|
|
10,000
|
0.09
|
0.13
|
0.196
|
0.233
|
0.37
|
0.683
|
1.623
|
3.056
|
|
20,000
|
0.526
|
0.956
|
1.136
|
1.246
|
2.316
|
3.44
|
9.956
|
18.796
|
|
30,000
|
1.383
|
2.363
|
3.013
|
2.943
|
5.236
|
9.246
|
23.626
|
46.536
|
|
40,000
|
2.61
|
3.68
|
5.09
|
5.916
|
10.84
|
18.233
|
42.253
|
85.866
|
|
50,000
|
4.206
|
6.06
|
7.98
|
8.806
|
15.913
|
29.496
|
68.583
|
134.423
|
|
60,000
|
5.336
|
8.096
|
11.96
|
12.93
|
22.776
|
41.67
|
99.033
|
195.47
|
|
70,000
|
7.15
|
10.753
|
15.493
|
17.536
|
31.146
|
56.303
|
136.98
|
266.03
|
|
80,000
|
9.03
|
14.643
|
21.13
|
22.84
|
40.01
|
75.433
|
177.636
|
350.563
|
|
90,000
|
10.94
|
18.373
|
26.546
|
29.346
|
52.6
|
95.79
|
224.196
|
443.503
|
|
100,000
|
13.29
|
21.596
|
30.676
|
34.79
|
63.193
|
116.42
|
279.21
|
551.986
|
Calculating a single percentile value from a dataset containing 10,000 rows took 0.09 seconds. When we increase the number of rows to 100,000 it took 13.29 second.
Calculating 101 percentile values from a dataset contain 10,000 rows took 3.056 seconds. When we increase the number of rows to 100,000 it took 551.986 seconds.
Here's a graphical representation of the results.
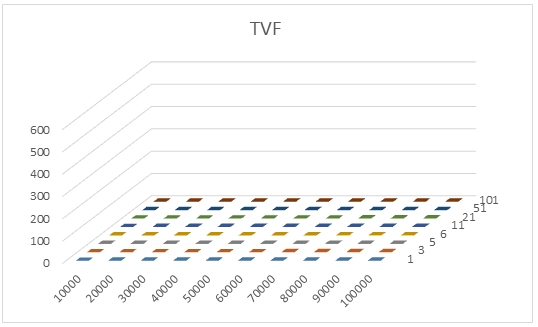
We modified the script to perform the same calculations using the table-valued function. We couldn’t use the same script because the syntax for table-valued functions and aggregate function are different. Here are the results of that test.
|
|
Elapsed Time in Seconds
|
|
|
1
|
3
|
5
|
6
|
11
|
21
|
51
|
101
|
|
10,000
|
0.043
|
0.043
|
0.053
|
0.043
|
0.046
|
0.04
|
0.043
|
0.043
|
|
20,000
|
0.09
|
0.09
|
0.09
|
0.09
|
0.09
|
0.103
|
0.126
|
0.116
|
|
30,000
|
0.136
|
0.133
|
0.133
|
0.133
|
0.136
|
0.136
|
0.136
|
0.133
|
|
40,000
|
0.193
|
0.176
|
0.183
|
0.18
|
0.183
|
0.183
|
0.176
|
0.183
|
|
50,000
|
0.23
|
0.263
|
0.236
|
0.226
|
0.223
|
0.226
|
0.23
|
0.226
|
|
60,000
|
0.273
|
0.28
|
0.276
|
0.293
|
0.276
|
0.276
|
0.27
|
0.276
|
|
70,000
|
0.366
|
0.336
|
0.346
|
0.33
|
0.346
|
0.336
|
0.366
|
0.34
|
|
80,000
|
0.45
|
0.396
|
0.39
|
0.396
|
0.42
|
0.383
|
0.39
|
0.41
|
|
90,000
|
0.43
|
0.456
|
0.443
|
0.453
|
0.473
|
0.436
|
0.436
|
0.446
|
|
100,000
|
0.543
|
0.506
|
0.483
|
0.583
|
0.486
|
0.526
|
0.49
|
0.513
|
Calculating a single percentile from a dataset containing 10,000 rows took 0.043 seconds. Calculating 101 percentiles from the dataset also taking 0.043 seconds.
Calculating a single percentile from a dataset containing 100,000 rows took 0.543 seconds. Calculating 101 percentiles from the dataset took 0.513 seconds.
In other words, from 10,000 rows to 100,000 rows and from 1 point to 101 points it never took more 0.543 seconds to calculate the results; far better than the aggregate's performance.
Here are the results of the tests of the table-valued function, using the same scale as the results from aggregate function.
XLeratorDB will continue to provide the aggregate functions PERCENTILE and PERCENITLE_EXC as well as providing the new table-valued function PERCENTILES. You can decide which better suits your needs.
If you are already using XLeratorDB, just login to your account and re-download the software from your 'My Orders' page to check it out. If haven't already tried XLeratorDB, just click here to get the 15-day trial and discover how to turn your SQL Server into an analytics engine.