The Hypergeometric Distribution in SQL Server
Oct
6
Written by:
Charles Flock
10/6/2015 3:33 PM

The hypergeometric distribution and its cousin the negative hypergeometric distribution are categorized as urn problems in statistics. In this article we look at some of the math behind urn problems.
Urn problems deal with problems that can be constructed in the following way. Imagine that you have an urn and it is filled with a known number of balls. The balls come in only 2 colors and in addition to knowing the number of balls we also know how many of each color are in the urn. Let’s assume that balls are either black or white and that they are distributed evenly throughout the urn and that other than the color there is no difference between them.
If we randomly select balls from the urn, without returning them to the urn, is it possible to make some estimate of how many of each color will end up in our sample?
Let’s assume that we have an urn filled with 110 balls of which 99 are white and 11 are black. If we randomly draw 10 balls from the urn, how many of them will be white? We can use the hypergeometric distribution to answer this question.
In our random sample of 10 balls, there are 11 possible outcomes for the number of white balls in the sample; 0 through 11. In the following SQL, we calculate the probabilities for each of those 11 outcomes and then graph the results.
SELECT
SeriesValue as num_white,
wct.HYPGEOM_DIST(seriesvalue,10,99,110,'False') as p
FROM
wct.SeriesInt(0,10,NULL,NULL,NULL)
This produces the following result.
Here is a graph of the output.
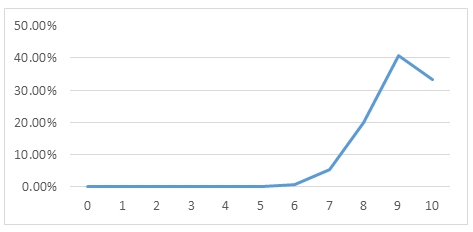
Even though 90% of the balls in the urn are white, in our random sample of 10 balls, there is only about a 40.6% chance that we will have exactly 9 white balls. How can that be?
Let’s look first at the probability of drawing 10 white balls. Each time we draw a ball we reduce the number of white balls in the urn so that the probability of drawing 10 out of 10 white balls is simply the product of the probabilities for each of the 10 draws.

Now let’s assume that in our sample the balls were drawn in the following order: WWWWWWWWWB. The only difference between this sample and the sample of 10 white balls is that on the last draw we select 1 of the 11 black balls rather than 1 of the 90 remaining white balls. Thus the probability on each draw looks like this.

This equation calculated the probability of generating a sample where the first 9 balls drawn were white balls and the 10th was black. What we are actually interested in, however, is all the possible arrangements of 9 white balls and 1 black ball in a sample of 10. Obviously, there are 10 possible arrangements.
BWWWWWWWWWW
WBWWWWWWWWW
WWBWWWWWWWW
WWWBWWWWWWW
WWWWBWWWWWW
WWWWWBWWWWW
WWWWWWBWWWW
WWWWWWWBWWW
WWWWWWWWBWW
WWWWWWWWWBW
WWWWWWWWWWB
Since the calculation of the probability is just the product of each probability at the time a ball is drawn, the commutative property of multiplication tells us that order doesn’t matter. Thus modifying our equation to account for all the possible arrangements is straightforward.
This demonstrates that even though 90% of the balls are white there is only a 40.6% chance of having exactly 9 balls in a random sample of 10 balls.
There are 45 possible arrangements of 2 black and 8 white balls and the probability calculation looks like this.

The following SQL shows how all the probabilities can be calculated from the probability of drawing 10 white balls in the sample.
with pmf as (
SELECT
SW,
SB,
NB as t1,
NW-SW+1 as t2,
SW as t3,
(SB+1) as t4,
wct.FACT(NW)/wct.FACT(NW-(SW+SB))/(wct.FACT(NW+NB)/wct.FACT(NW+NB-(SW+SB))) as p
FROM (VALUES(10,0,99,11))n(SW,SB,NW,NB)
UNION ALL
SELECT
SW-1,
SB+1,
t1-1,
t2+1,
t3-1,
t4+1,
P*t1/t2*t3/t4
FROM
pmf
WHERE
SW > 0
)
SELECT
*
FROM
pmf
This produces the following result.
This calculation is known as the probability mass function of the hypergeometric distribution. The probability mass function, or pmf, is concerned with the probability of getting the exact number of white balls in our sample.
We might be more interested, though, in calculating the probability of getting at least 9 white balls in our sample of 10 balls. To do that, we need to use the cumulative distribution function, or cdf, of the hypergeometric distribution.
The cdf of the hypergeometric distribution is simply the sum of the pmf values. For example, if we wanted to know the probability of getting 9 or fewer white balls in our sample the cdf would be the sum of the pmf values for 0 through 9 white balls. The following SQL shows this relationship.
SELECT
*,
SUM(pmf) OVER (ORDER BY num_white) as cum_pmf,
wct.HYPGEOM_DIST(num_white,10,99,110,'True') as cdf
FROM (
SELECT
SeriesValue as num_white,
wct.HYPGEOM_DIST(seriesvalue,10,99,110,'False') as pmf
FROM
wct.SeriesInt(0,10,NULL,NULL,NULL)
)n
This produces the following result.
As suggested by the table above, the sum of all the pmfs for a sample size is always 1. Thus to calculate the probability of our sample containing 9 or more white balls, we can simply calculate 1 minus the probability of having 8 or fewer balls.
SELECT
1 - wct.HYPGEOM_DIST(8,10,99,110,'True') as p
This produces the following result.
Alternatively, we could rephrase the problem slightly and calculate the cumulative distribution of selecting 1 or fewer black balls from a population of 110 balls containing 11 black balls.
SELECT
wct.HYPGEOM_DIST(1,10,11,110,'True') as p
This returns the same result as above.
The answer to the problem is approximately 73.8%. In other words, even though 90% of the balls in the urn are white, there is only a 73.8% chance that our random sample of 10 balls will be 90% white.
The HYPGEOM_INV function calculates the inverse of the hypergeometric distribution which should not be confused with the negative hypergeometric distribution (NEGHYPGEOM_DIST). The inverse hypergeometric distribution calculates the number of successes in a given sample where the population size and the population number of successes is known. The HYPGEOM_INV function returns the smallest value for the number of successes in the trial such that the p-value is greater than or equal to the supplied p-value.
If the number of successes in the population is not known, the HYPGEOM_INV function can be used to make an estimate of the population successes based on a sample. Let’s say that we randomly draw 100 balls from an urn containing 100,000 balls and the sample contains 80 black balls and 20 white balls. Using the HYPGEOM_INV function we can make some inferences about the composition of the urn.
As with all statistical inferences, we need to specify a confidence interval. In this particular example, our confidence interval is 95%. We will set alpha to 1 minus the confidence interval and the lower bound of the confidence interval to alpha * 0.5 and the upper bound equal to 1 minus alpha * 0.5.
We can then run the following SQL, which calculates the upper and lower bounds of the number of white balls in the population based in the confidence interval
DECLARE @sample_white as float = 20
DECLARE @sample_black as float = 80
DECLARE @population as float = 100000
DECLARE @ci as float = 0.95
DECLARE @alpha as float = 1e+00 - @ci
DECLARE @ub as float = 1e+00 - @alpha * 0.5
DECLARE @lb as float = @alpha * 0.5
SELECT
MAX(white_percent) * @population as pop_white, ci
FROM (
SELECT
k.SeriesValue as white_percent
,x.ci
,wct.HYPGEOM_INV(x.ci,@sample_white+@sample_black,k.seriesvalue*@population,@population) as num_white
FROM
wct.SeriesFloat(0,1,.0001,NULL,NULL)k
CROSS APPLY(VALUES (@ub),(@lb))x(ci)
)n
WHERE
num_white = @sample_white
GROUP BY
ci
ORDER BY
1
This produces the following result.
We can conclude, based on our sample that 95% of the time the number of white balls in the population is between 13,490 and 29,170
We can also come up with an estimate of the number of black balls in the population by running the following SQL.
SELECT
MAX(black_percent) * @population as pop_black, ci
FROM (
SELECT
k.SeriesValue as black_percent
,x.ci
,wct.HYPGEOM_INV(x.ci,@sample_white+@sample_black,k.seriesvalue*@population,@population) as num_white
FROM
wct.SeriesFloat(0,1,.0001,NULL,NULL)k
CROSS APPLY(VALUES (@ub),(@lb))x(ci)
)n
WHERE
num_white = @sample_black
GROUP BY
ci
ORDER BY
1
This produces the following result.
This tells us that 95% of the time the number of black balls in the population is between 71,930 and 87,330.
It’s possible to refine the estimate by changing the @StepValue passed into the SeriesFloat function, but 4 decimal place should be sufficient for most purposes and every increase in the number of decimal places results in a ten-fold increase in the number of calculations performed by HYPGEOM_INV.
One other interesting thing that we can do with the HYPGEOM_INV function is generate random numbers from a hypergeometric distribution. In the following example, we create 100,000 trials from a hypergeometric distribution where the sample size is 106 and the number of white balls is 30,000 and the number of black balls in 70,000.
DECLARE @num_trial as float = 106
DECLARE @pop_success as float = 30000
DECLARE @pop_size as float = 100000
SELECT
num_success, count(*) as cnt
FROM (
SELECT
wct.HYPGEOM_INV(SeriesValue,@num_trial,@pop_success,@pop_size) as num_success
FROM
wct.SeriesFloat(0,1,NULL,100000,'R')k
)n
GROUP BY
num_success
ORDER BY 1
This produces the following result (your result will be different).
This is what a graph of the output looks like.
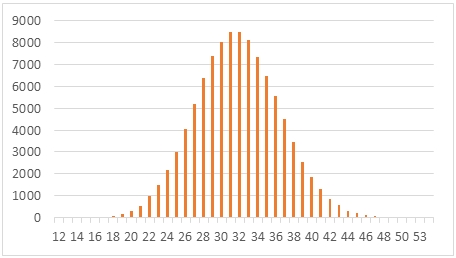
As you can see, this actually approximates the normal distribution. In fact, under certain conditions the normal distribution can approximate the hypergeometric distribution.
In this SQL, we calculate mean (mu) and the standard deviations (sigma) from the generated random numbers as well as provide estimated values calculated from the parameters of the hypergeometric distribution.
DECLARE @num_trial as float = 106
DECLARE @pop_success as float = 30000
DECLARE @pop_size as float = 100000
SELECT
AVG(num_success) as mu
,STDEV(num_success) as sigma
,@num_Trial*@pop_success/@pop_size as mu_estimated
,SQRT((@num_Trial*(@pop_success/@pop_size))*((@pop_size-@pop_success)/@pop_size)*((@pop_size-@num_trial)/(@pop_size-1))) as sigma_estimated
FROM (
SELECT
wct.HYPGEOM_INV(SeriesValue,@num_trial,@pop_success,@pop_size) as num_success
FROM
wct.SeriesFloat(0,1,NULL,100000,'R')k
)n
This produces the following result.
While this is an interesting property of the hypergeometric distribution, it is generally not advisable to substitute the normal distribution. First, and most obviously, the normal distribution is a continuous distribution while the hypergeometric distribution is a discrete distribution. Thus, you would either need to take the floor or the ceiling of the results from the normal distribution. Something like this, for example.
DECLARE @num_trial as float = 106
DECLARE @pop_success as float = 30000
DECLARE @pop_size as float = 100000
SELECT
FLOOR(x), COUNT(*)
FROM
wct.RANDNORMAL(100000,@num_Trial*@pop_success/@pop_size,SQRT((@num_Trial*(@pop_success/@pop_size))*((@pop_size-@pop_success)/@pop_size)*((@pop_size-@num_trial)/(@pop_size-1))))
GROUP BY
FLOOR(x)
ORDER BY
1
Second, and perhaps more importantly, the normal approximation of the hypergeometric distribution is only good in certain regions. However, given how well the HYPGEOM_INV function performs, there is no reason to go use the normal distribution rather than the hypergeometric distribution.
There are lots of problems that can be constructed as urn problems and the hypergeometric distribution is a very used tool to have for evaluating outcomes of those problems. You can try out the hypergeometric distribution in SQL Server today by downloading the free 15-day free trial. It only takes about minute to download and a minute to install. Give it a try and tell us what you think.