Enhanced Present and Future Value Calculations
Feb
13
Written by:
Charles Flock
2/13/2011 3:42 PM

In addition to the new multi-input aggregates available in XLeratorDB/financial 2008, we have added some new scalar functions that provide even greater flexibility for time-value-of-money calculations.
XLeratorDB was originally designed with the idea of making every EXCEL function available as a SQL Server function. But why stop there? In our latest release we add a dozen new functions to our growing list of functions that you won’t find in EXCEL.
EXCEL provides the capability to calculate: the present value of an annuity with the PV function; the present value of a series of periodic cash flows with the NPV function; and, the present value of a series of irregular cash flows with the XNPV function. You can calculate the future value of an annuity using the FV function. There is also an FVSCHEDULE function, which lets you compound a series of periodic interest rates, but does not contain any amount. All of these functions have been built into XLeratorDB.
We added two new aggregates for the calculation of future values. The NFV function looks like the NPV function and the XNFV looks like the XNPV function, but they calculate the future value rather than the present value.
We find the whole EXCEL paradigm limiting, however. The first limitation is in the scaling of time. The PV function and the NPV function are only concerned with periods, and they are only concerned with the periods contained in the function. We also find that the PV function and the NPV function have different interpretations of periods and return opposing signs, and can be quite confusing. Let’s look at a simple example.
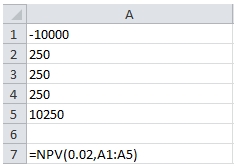
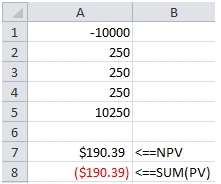
We have 5 cash flows entered in the range A1:A5. We would expect the NPV calculation to be the sum of the PV amounts, with A1 representing period 0, meaning that the PV amount will be equal to the cash flow amount, and A5 representing period 4. We can use the array formula capability of EXCEL to enter that calculation.
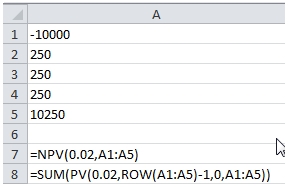
Let’s look at the results.
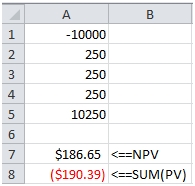
The amounts don’t agree. There are two reasons for this. The first is that for some unknown reason the EXCEL PV function flips the sign on the cash flows. The second, and you can check the EXCEL documentation on this, is that to correctly calculate NPV in EXCEL, the first cash flow should be outside the function. So the formula should look like this:
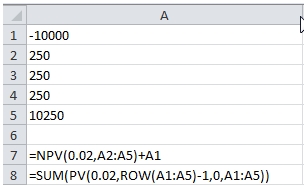
This produces the following result.
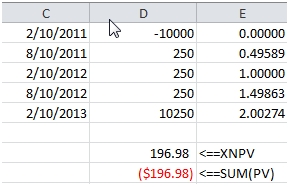
The XNPV function is a little better in that it is designed to include the first cash flow. As with the NPV function, the sign returned by the PV calculation is opposite the sign returned by XNPV. We can use the PV function, in conjunction with YEARFRAC function to replicate the XNPV calculation.
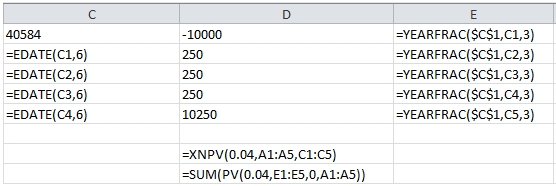
This produces the following result.
The second limitation has to do with the rates. The NPV and XNPV functions take a single rate for all the cash flows, so a cash flow that is due in 20 days is discounted using the same rate as a cash flow that is due in 20 years. I guess this is OK for quick and dirty calculations, but you would be able to perform a far more sophisticated analysis if you could use a yield curve in calculating the present or future value.
Generally, the yield curve will consist of annual rates for a maturity horizon. It seems straightforward that we would then want to use the annual rates without having to convert them into a ‘period’ rate.
So, we created 4 functions that always use annual rates and always return the present or future value with the same sign as the cash flow. There are 2 for present value calculations: EPV and XPV; and 2 for future value calculations: EFV and XFV. Combined with the SUM function and the XLeratorDB interpolation functions, these provide a very powerful and flexible mechanism for calculating present and future values on large data sets (or even small ones).
The XPV function calculates the present value of a cash flow given a start date, the date of the cash flow, and the rate. The calculation of the discounted amount is very straightforward.

This produces the following result.
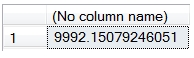
We specified a single rate, 0.159%, which in this case represents the 6-month money market rate and used that value discount the cash flow to today. However, the real value here is in being able to calculate a different rate for the date of each cash flow. To do that will need a yield curve and an interpolation function. We will use the SPLINE_q function for interpolation.
In this example, we have a simple RATES table which consists of a basic US Treasury yield curve, and we have a table contain the future cash flows for some investments that we want to discount using the interpolated US Treasury yield curve. The SQL is pretty concise:
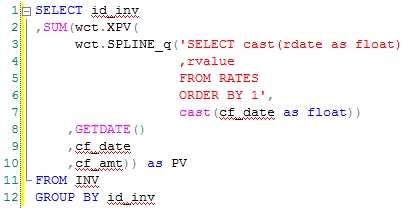
This produces the following result:
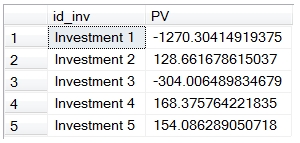
The PV has been calculated for each cash flow and then summed and grouped by something called investment id. You could have done this for a million cash flows in just a couple of seconds. There really is no good way to this in EXCEL or in most other tools that I can think of. It’s actually pretty hard to do this in a lot of applications. With this function, though, it’s very simple, flexible, and powerful.
The EPV function works similarly to the XPV function, except that it uses periods instead of dates. I think that the best way to use the function is to always make the period, effectively, a year and to use fractional periods. This way, you can always the market-observable rates and not have to translate rates into semi-annual, quarterly or monthly rates.
One great way to do this is to use the YEARFRAC function. YEARFRAC will automatically convert the number of days between 2 dates into a fractional part of the year, using the specified interest basis code. In our previous example, that could actually become import, because the XPV, like the XNPV function, always uses an actual/365 interest basis. US Treasuries, however, are quoted on the actual/actual interest basis, so you might be interested in using that interest basis. To do that, you could enter SQL that looks like this.
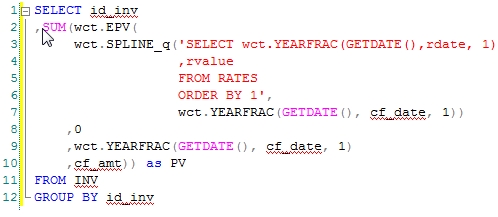
This produces the following result.
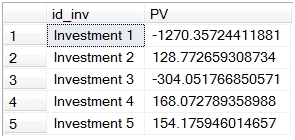
This differs from the previous example because of the change in interest basis from actual/actual to actual/365.
The future value calculation is somewhat more complicated. When analyzing a series of cash flows, the basic calculation requires multiplying the cash flow by a factor which represents the interest rate between the cash flow date and the end date. This rate is generally called the forward-forward rate.
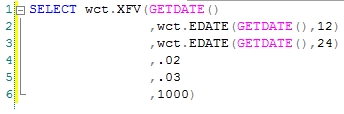
Here’s a simple example. At the end of year 1 we will receive 1,000. If we were to invest that amount for one additional year, what it would be worth at the end of two years’ time? Let’s assume that the one-year rate is 2% and the two-year rate is 3%.
This returns the following result.
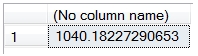
Which implies that the one-year rate, one-year from now, is slightly more than 4%. How did we come up with that value?
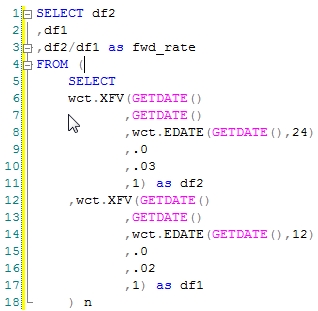
The one-year forward rate is actually going to be the ratio between the discount factors between the one-year rate and the two-year rate. We can use the XFV function to do that calculation for us.
This produces the following result.
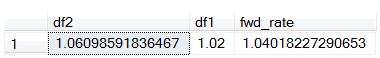
The forward rate is the ratio between df2 and df1. In order to do a meaningful forward value calculation, this is precisely the rate that needs to be used. But, the EXCEL FV function requires you to do that calculation outside of the function. That’s why we came up with the XFV and the EFV functions. They require three dates and two rates to be input, but that’s the nature of the calculation. Of course, we continue to have an FV function that works just like EXCEL’s.
Like the enhanced present value functions, the enhanced future value functions can be combined with the SUM and interpolation functions providing a powerful tool for doing sophisticated cash flow analysis on data sets of any size. We think that, in many ways, they are actually easier to use than EXCEL, and certainly much easier than exporting data to EXCEL or trying to do this kind of calculation in Reporting Services. Let us know what you think.